Thanks, Walter, for your comments on BSFC and the
IO-550N.
They motivated me to dig back into my files where I
found a chart of the brake specific fuel consumption (BSFC) for the liquid-cooled
Continental Voyager engine used in the Voyager around the world flight.
This engine is a little fellow compared to what most of us fly, about 50 cubic
inches per cylinder as opposed to 80-90 inches per cylinder in our fire
breathing Lancairs so breathing characteristics and heat losses will be
different. But the numbers and trends are interesting. Note that
with the cooler liquid-cooled heads, the compression ratio was raised to
11.4.
As expected lower RPM yields lower SFC because of
lower friction losses. And higher manifold pressures yield lower SFC
because of lower pumping losses across the throttle plate. Lindberg
understood this and ran high manifold pressures and low RPM crossing the Atlantic. For those of us
with aspirated engines, it means climb until the throttle is wide open
delivering the manifold pressure you want, and then adjust horsepower with the RPM
knob.
I have also attached a chart I have published here
before which shows the THEORETICAL engine efficiency (no losses, no friction) versus
compression ratio which shows the trend of efficiency versus compression ratio.
It was taken from Taylor’s textbook on IC engines.
To make some of this discussion a bit easier to
compare, I calculated SFC vs. fuel flow in HP per gallon per hour (the figure
that has been kicked around here earlier) for various specific fuel
consumptions and the results are presented below.
|
SFC
|
HP/gallon per hour
|
Comments
|
|
0.45
|
13.0
|
|
|
0.44
|
13.3
|
|
|
0.43
|
13.6
|
7.5 CR = 13.7
|
|
0.42
|
13.9
|
|
|
0.41
|
14.3
|
|
|
0.4
|
14.6
|
|
|
0.39
|
15.0
|
IO-550N = 0.385, 8.5 CR = 14.9
|
|
0.38
|
15.4
|
|
|
0.37
|
15.8
|
|
|
0.36
|
16.3
|
IOL-200 CR 11.4 = 16.0
|
|
0.35
|
16.7
|
|
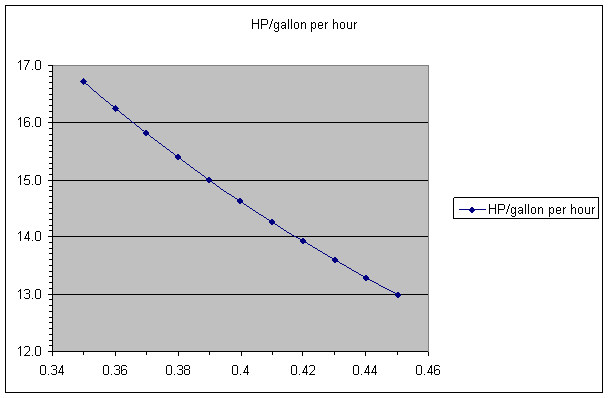
In the figure above, the vertical axis is HP per gallon per hour, and
the horizontal is SFC in pounds per horsepower hour. For the conversion
between the two, I used Walter’s figure of 5.85 pounds per gallon for
avgas. Note that as the SFC drops below 0.36, you are getting into
automotive (read Theilert) diesel areas.
Just for fun I plotted the compression ratios versus fuel consumption
using Walter’s suggestions and the 65% best economy point for the liquid
cooled IOL-200, and this came out.
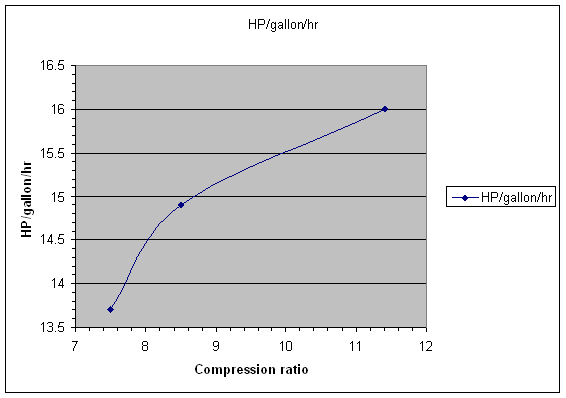
Thus if you are cruising around with one of those IO-550’s
with 10:1 compression ratio, and want to run LOP at 65% of originally
rated horsepower (310x65%=201 HP), expect to burn about 201/15.5 = 13 gallons
per hour. This will put about the same load on the engine that the factory did
when it tested and approved LOP operation for this engine at 65% power with the
lower compression ratio. If you are indicating 200 knots and getting most
of the ram pressure into your induction system, 65% power should be available with
these engines up to about 15-16,000 feet, depending on temperature. I would ask
those of you who are flying to share some data to see if this conjecture is
borne out in practice.
What is not shown is the band of uncertainty around
all these curves created by variations in engines and variations in
instrumentation. I would expect that fuel flow instrumentation is
probably no better than plus or minus 1% across the fleet, probably more, and
this converts to an uncertainty band of about 0.2-0.3 HP/gallon/hr on this last
chart. I expect the variation between even carefully built engines to be
about the same. Factory variations are larger. Keep in mind that
uniformity of fuel/air mixture will affect the results. The closer the
cylinders are together when they reach peak EGT (goal of GAMI injectors), the
better will be the resulting efficiency. Consequently carbureted engines
with poorer mixture distribution would be expected to do a bit worse than
shown.
Of course, your mileage may vary. J
Fred Moreno