Chris wrote:
What is the power level below
which running even at peak EGT cannot do any harm to the engine? Say less than
65% or 21" MP or something else. There must be some dividing line
between idle and full power.
Go to John Deakin’s “Pelican’s Perch”
series on line (http://www.avweb.com/news/pelican/182544-1.html
) and you will find a series of interesting articles on leaning derived from
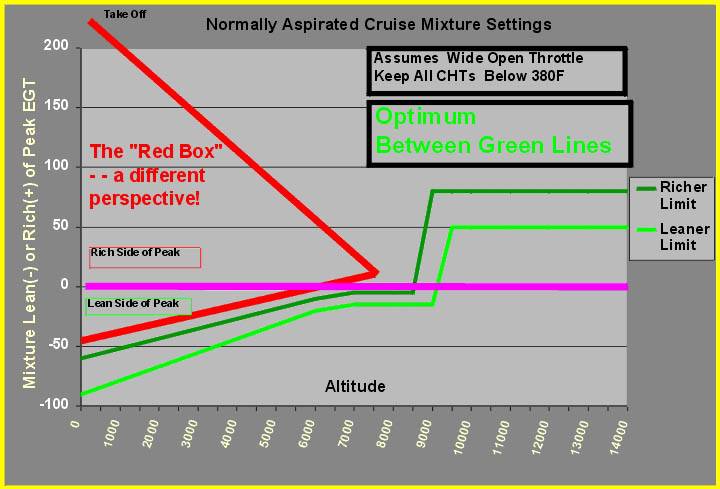
GAMI test results. For the IO-550 he refers to a “red box” and
elsewhere talks about a “red wedge” which shows the forbidden
territory. Above about 60-65% you can set mixture with impunity and do no
damage according to his reports. He does show you can lean at 80% power with
this engine, but as I recall it must be 75-80F lean of peak. I copied his
tables and the picture of the red wedge and have them on my clip board in the
airplane.
Here is one version for maximum power (speed) at the higher
altitudes (rich of peak). For best economy you stay at 50F lean of peak at
these higher altitude settings. His columns explain his reasoning about what
constitutes “optimum.” Briefly, if power is low enough to permit operation
over a wide range of mixture settings (generally below 65%), operating a bit
rich of peak burns a bit more fuel, but provides significantly more HP and
speed compared to the pure economy case (50F lean of peak) so for best combination of speed and economy, run between the green lines. (Being
cheap, I run at best economy all the time, but you may be in a hurry.)
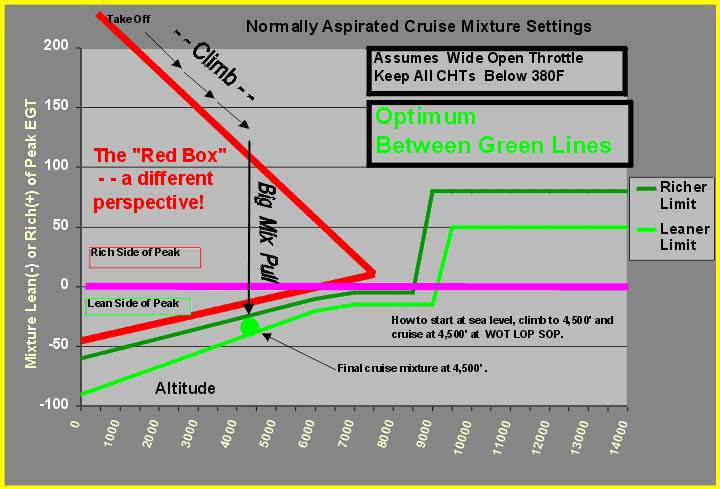
and here is a version showing his recommended mixture
management plotted on the chart.
Clarification on mixture settings:
Best power is usually 75-150F rich of peak depending on the
engine. The curve in this region is relatively flat. You can find it by
climbing to cruise altitude, setting cruise power, and then starting rich,
slowly lean until you get best speed. Use the altitude hold on your autopilot
to carefully control speed and make your changes slowly. I recommend doing this at 8500 or above so that power
will be at a nice cruise power setting.
Highly boosted engines run a lot richer than best power for
take off for additional cooling and to prevent detonation when the cylinders
are hot.
Factory recommended setting (based on a lot of tradition and
history before we had good instrumentation) is 50F rich of peak for many
engines. This
turns out to be the worst place to operate for many engines, particularly at
high power settings.
But will the factory change its recommendation? Nope. It opens
them to criticism that past advice may be wrong.
Best fuel economy (lowest brake specific fuel consumption)
is about 50F lean of peak.
I have taken the liberty of copying some of Deakin’s
material below since it is directly relevant to this discussion. I highlighted
some key points. Read carefully, or even better read his series of articles. It
may take a couple of evenings to fully digest, but the education is worth it.
Fred Moreno
From: http://www.avweb.com/news/pelican/182084-1.html
Now,
please stop right here. DO NOT just skip over that chart, it's
important. It looks a little complicated, because there are four parameters on
one chart, and each needs to be understood. If you are not prepared to
understand that chart, I don't think you can understand how to operate your
engine properly, much less understand the rest of this column. Please
take the time, right now, to follow me through on this chart!
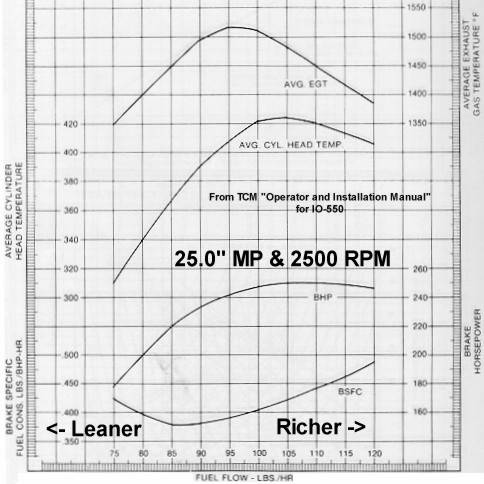
The entire chart represents data while running at 25.0 inches of
manifold pressure and 2,500 RPM. Those are held constant — only the
mixture changes.
Please
read the preceding paragraph again, it's VERY important.
The only
variable is the fuel flow, plotted across the bottom of the chart, and all four
parameters are plotted against that fuel flow from 75 to 120 pounds per hour
(PPH). This gives a lovely picture of the relationships. Note that
"Richer" is again to the right on this chart (I could have
swapped some of these charts left to right to make them all the same, but
preferred to stick to "authentic.")
The right
side of the chart is not necessarily "Full Rich". For whatever
reasons, TCM chose to show just the range of fuel flows from 75 to 120 PPH on
this IO-550, while "full rich" at sea level is about 162 PPH
The top
curve shows EGT, aligned with the numbers on the right side, from a low of
1,350° at 75 PPH (lean), peaking at about 1,520° F at 95 PPH, and dropping
again to 1,380° F at 120 PPH (rich). This is a classic EGT curve, and many of
you will be familiar with it. There, now that's not so bad, is it? And you
thought this chart was too complicated!
Below
that is the CHT curve, with the scale at the left. About 310° F at 75 PPH
(lean), peaking at about 425° F at 105 PPH, dropping again to about 405° F at
120 PPH (rich). Note the CHT peaks at a substantially richer mixture than EGT.
(In fact, you'll see that the hottest CHT occurs at the point where EGT is about
50° F rich of peak (ROP). Hmmm, where have we heard that before?)
The third
trace from the top is "brake horsepower" (BHP), which we can just
call "Power" as delivered to the shaft. The numbers for this trace
are on the right, and our trace shows 180 HP at 75 PPH (lean), peak at about
250 HP for fairly broad range of fuel flows, and drops only slightly to about
245 HP at 120 PPH (rich). Note that going all the way to "Full Rich"
would produce a good deal more fuel flow and a good deal less power.
Finally,
the bottom curve depicts "Brake Specific Fuel Consumption" (BSFC).
This fancy-sounding engineering term is nothing more than the fuel required to
produce one horsepower (HP) for one hour.
A useful
trick to help you understand this chart is to lay a clear plastic ruler
vertically on the chart. Keeping it vertically oriented, move it back and forth
horizontally. As one end of the ruler moves over the fuel flow scale at the
bottom of the page, the four curves will move up and down along the ruler's
straightedge, just as those parameters move up and down in the real world.
Remember
earlier, where I said we could lean a lot and only lose a little power? Well,
this curve gives us a visual idea of how that works. At 75 PPH (lean), it takes
about 0.425 pounds to produce one HP for one hour. In the range 85 to 95 PPH,
less fuel is required: about 0.385 pounds of fuel. Enrich further to 120 PPH,
and you'll be burning about 0.480 pounds of fuel to produce one HP for one
hour. In this case, "less is better" if we're looking for economy.
BSFC is a very useful term, as it is a direct indication of an engine's
efficiency. Modern automobile engines, contrary to popular belief, are not very
efficient, having BSFCs above 0.42 or so. They are designed to run very clean,
however, and sacrifice some efficiency as a result. TCM engines can achieve BSFCs
as low as 0.385 from the factory. With modifications, we're going to do better
than that. Not too shabby for "World War II technology," as so many
call it!
Now, here's the crucial concept behind this chart: All four curves
are carefully plotted with reference to the fuel flow scale at the bottom, and
this gives us a lovely opportunity to look at the relationships between them!
If you'd like to know what is happening to CHT as you fiddle with EGT, the
answer is here.
For
example, let's say we've leveled off in cruise, allowed things to settle down
and it's time to lean, at whatever MP and RPM you choose. Starting from full
rich (perhaps well off the right side of this chart and due to the enrichment
feature at full throttle), we start leaning. According to the chart, the EGT
and CHT will rise, and we know this to be true from experience. The power rises
only slightly. If you're going for absolute maximum altitude or speed, that
very flat "peak" in the BHP curve that occurs around 105 to 110 PPH
fuel flow will be helpful, and if you're making a high-altitude takeoff, it
will be very helpful. The BSFC is dropping as you lean, of course,
you're getting "more efficient."
So as the
mixture is leaned, power peaks first, with CHT peaking at very close to the
same point. In practical terms, if we lean to max CHT, we'll have max power for
that MP/RPM setting. Doesn't that make sense, intuitively? Max power, max CHT?
It's not precisely true, but it's close enough.
Ok, so
power peaks first, stays pretty flat, and then CHT peaks shortly thereafter.
With continued leaning, power and CHT drop together — very gradually at
first, then progressively more steeply — while BSFC continues to improve
and EGT continues to rise.
Continue
leaning, and EGT peaks and begins to fall, while BSFC continues to improve.
Sure, we're losing power, but fuel consumption is declining even faster, so our
"economy" (as measured by BSFC) is still getting better.
Finally,
BSFC bottoms out (at "best economy mixture"), and stays pretty flat
between 85 and 90 PPH. If we disregard the small difference between 0.385 and
0.400, we could even stretch the point a little, and say the BFSC curve is
"kinda flat" between 85 and 100 PPH. Look immediately above at the HP
curve, and note that for a small loss of fuel efficiency, we can pick up 25 to
30 HP? Isn't that interesting? We'll see later how that affects airplane
performance and efficiency, a very different subject. But to make a long story
short, if the power setting that results from optimizing engine efficiency
causes your airplane drop below the airspeed range that provides optimum
aerodynamic efficiency, you're not gaining anything! That's a whole 'nother can
o' worms. (I feel another column coming on.)
Let's say
we have carefully set up a real 65% of rated power, using the required
MP/RPM, with the mixture leaned to Best Power.
What
would happen to this if we increased the MP and/or RPM, keeping the mixture
constant at Best Power? More power to the shaft, right? Think about what this
might do to that chart. Since the power moves up, all the curves must move up.
Since the peak EGT will occur at a higher fuel flow, it must move to the right,
and all the other traces will move right, too, to preserve the
interrelationships.